TeGnostiX helps scientists transform massive biological datasets into meaningful insights by leveraging advancements in next-generation sequencing. We develop automated analysis pipelines and provide services across three key areas: classical data analysis, machine learning for patient stratification and biomarker discovery, and bioinformatics app development. Our classical data analysis includes genomics, transcriptomics, epigenomics, and other omics data, while our machine learning solutions focus on predicting disease pathogenicity. Additionally, we create web and mobile applications for analyzing and visualizing biological data, supporting researchers in deriving impactful conclusions from complex data.

Welcome to TeGnostiX

Make use of the revolution in the technology and:

 Integrate multi-omics data to identify molecular interactions and disease mechanisms.

 Develop predictive models for human pathology and disease classification using omics data.

 Characterize and predict cell types, including specific tumor and infection profiles.

 Predict biomarkers for diseases, specific cell types, or tumor subtypes.

 Identify druggable targets within gene pathways for therapeutic development.

 Conduct tissue, cell type, and disease-specific infection analysis.

 Compare novel research findings against existing published data for enhanced insights.

 Develop web and mobile apps for visualizing biological data and conducting research surveys.

Service

We provide diverse nature of services from classical data analysis to the development of deep learning models for biomarkers identification. We also develop apps for biological data. The Key Features of TeGnostiX

CLINICAL DATA ANALYSIS

CLINICAL DATA ANALYSIS
  • Identification of influential factors.
  • Impact of age and sex on disease state.
  • Meta-analysis of clinical measurements and disease association.
Contact Now

GENOMICS DATA ANALYSIS

GENOMICS DATA ANALYSIS
  • Variant calling (SNPs, indels).
  • Copy number analysis (gene copy numbers).
  • Genomic rearrangements.
  • Unkown genome assembly.
Contact Now

TRANSCRIPTOMICS DATA ANALYSIS

TRANSCRIPTOMICS DATA ANALYSIS
  • Single cell, Bulk and Small RNA (sRNA) sequencing analysis.
  • Cell type annotation and trajectory analysis.
  • Differential expresson analysis.
  • Pathway analysis.
Contact Now

EPIGENOMICS DATA ANALYSIS

EPIGENOMICS DATA ANALYSIS
  • DNA methylation data analysis.
  • Histone modification data analysis.
Contact Now

PROTEOMICS DATA ANALYSIS

PROTEOMICS DATA ANALYSIS
  • Mass spectrometry data analysis.
  • Enrichment & pathway analysis.
  • Protein protein-interactions.
  • Protein domain and motif analysis
Contact Now

MICROBIOME DATA ANALYSIS

MICROBIOME DATA ANALYSIS
  • Taxonomic and functional annotation.
  • Metagenome assembly.
  • Diversity analyses.
Contact Now

BIOMARKER PREDICTION

BIOMARKER PREDICTION
  • Identification of risk and disease biomarkers based on transcripomics, proteomics, GWAS, epigenomics and microbiome.
Contact Now

DEEP LEARNING MODELS

DEEP LEARNING MODELS
  • Pathogenicity prediction.
  • Patients stratification based on clinical and molecular signatures.
  • Cell type prediction.
  • Marker genes prediction.
Contact Now

BIOINFORMATICS APP DEVELOPMENT

BIOINFORMATICS APP DEVELOPMENT
  • Website development for biological data.
  • Database development for biological data.
  • Comparison with publicly available data.
  • Genome browser development for biological data.
  • Mobile app development for biological data.
Contact Now

FEATURED PROJECTS

Selected research highlights.

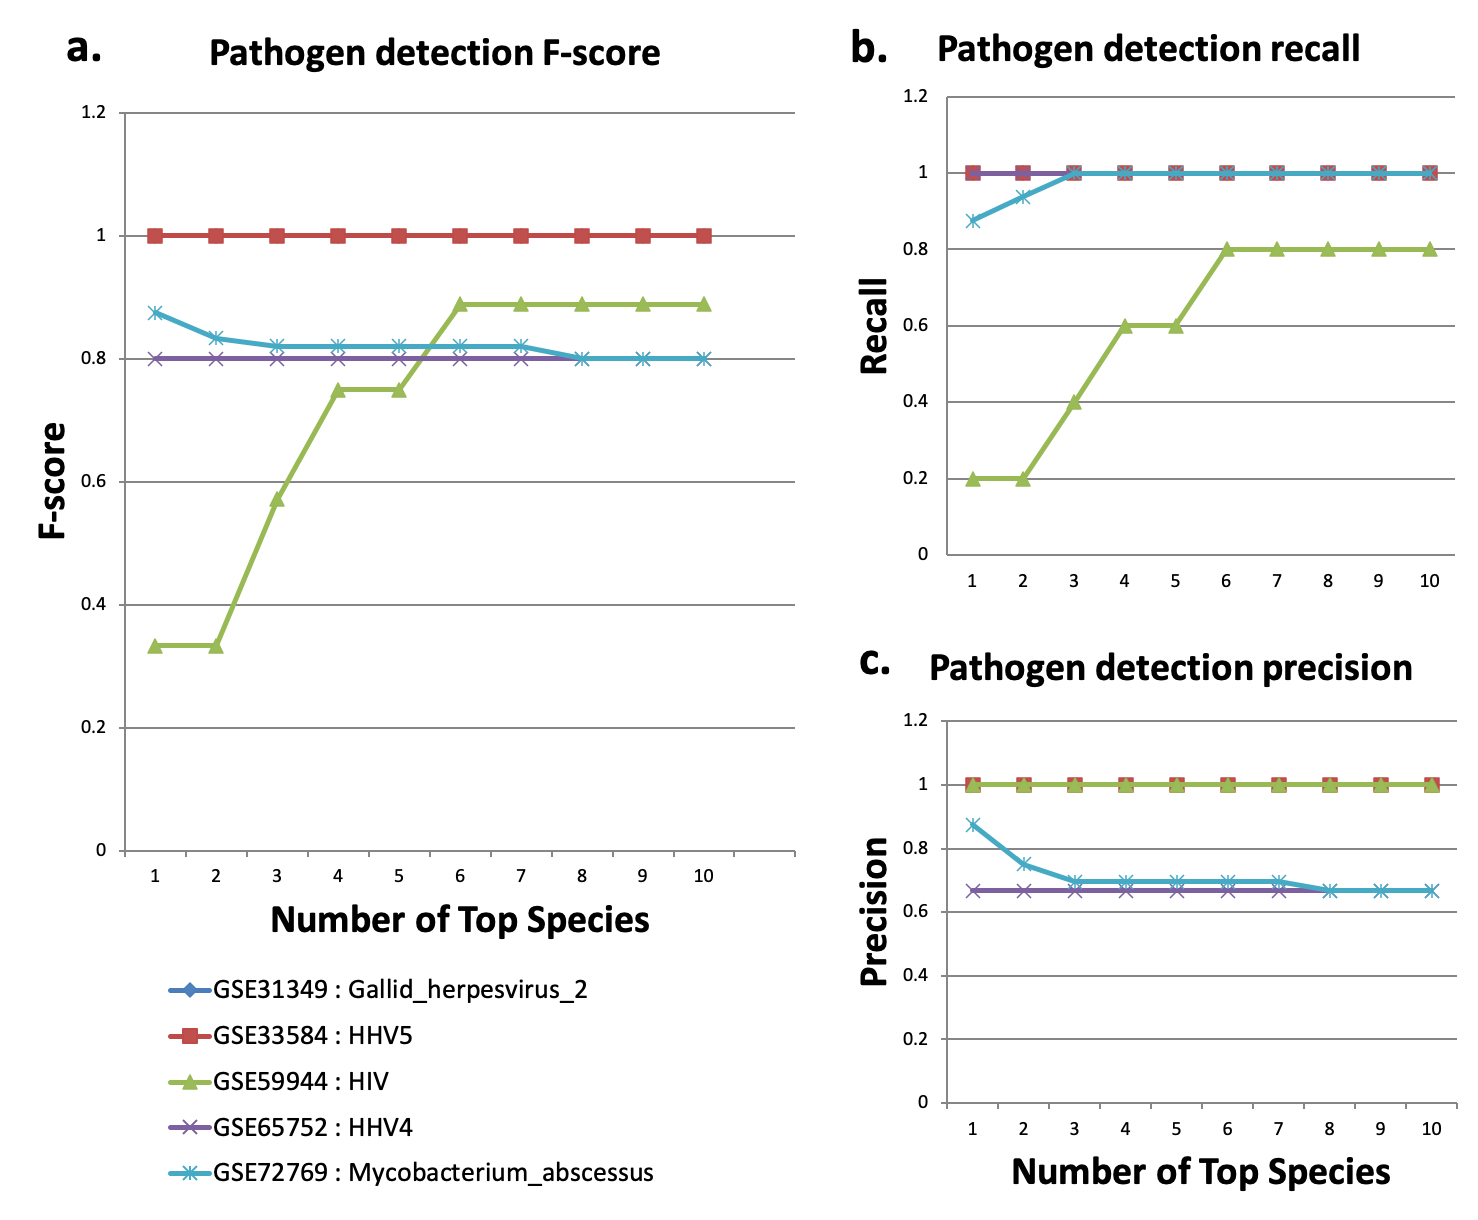
  • Pathogen detection performance: To assess the performance of ‘pathogen detection module’, small RNA sequencing datasets with defined viral or bacterial infections were analyzed and the F-score (a), recall (b), and precision (c) of the pathogen predictions were measured for the top 10 reported organisms. Overall, the prediction of bacterial (M. abscessus) and viral (HIV, HHV4, HHV5, Gallid herpesvirus 2) infections resulted in high F-scores, recall, and precision, especially when the top 5 predicted pathogen species are reported. In consequence, Oasis 2 currently reports the top five predicted pathogen species based on their read counts.

    Pathogen detection.

    Pathogen detection in sequencing data using Oasis2.

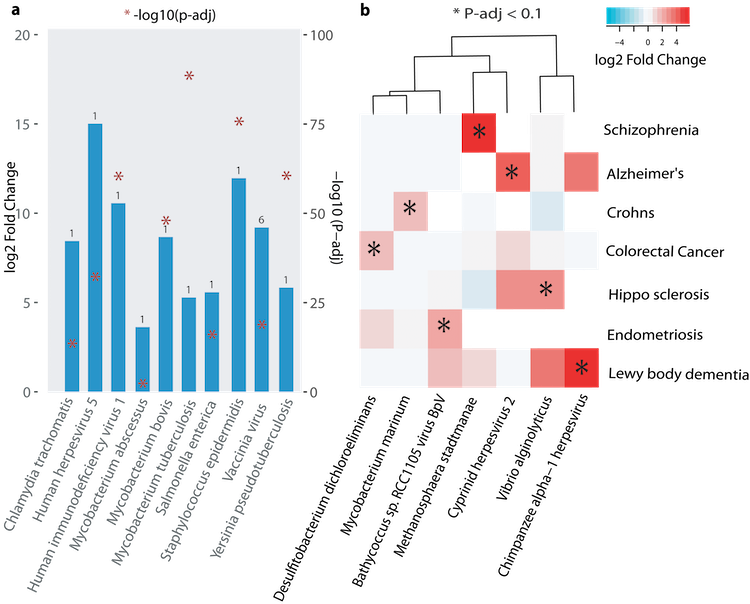
  • (A) Known associations. Pathogen detection using seven datasets known to be
                           infected with seven bacterial and three viral pathogens. Bar represents pathogen log2-fold difference between the uninfected
                           and infected state. Number on top of the bar denotes rank of the pathogen compared to all the other DE pathogens within t
                           he comparison (i.e. smallest adjusted P-value).
                           (B) Novel associations. Heatmap shows log2-fold difference of pathogens significantly upregulated in disease as compared to healthy (fold change > 1 and padj < 0.1).
                           Comparisons that have less than six pathogens significantly DE are selected for specificity.

    Bacterial and viral infections

    Pathogenic biomarker signatures.

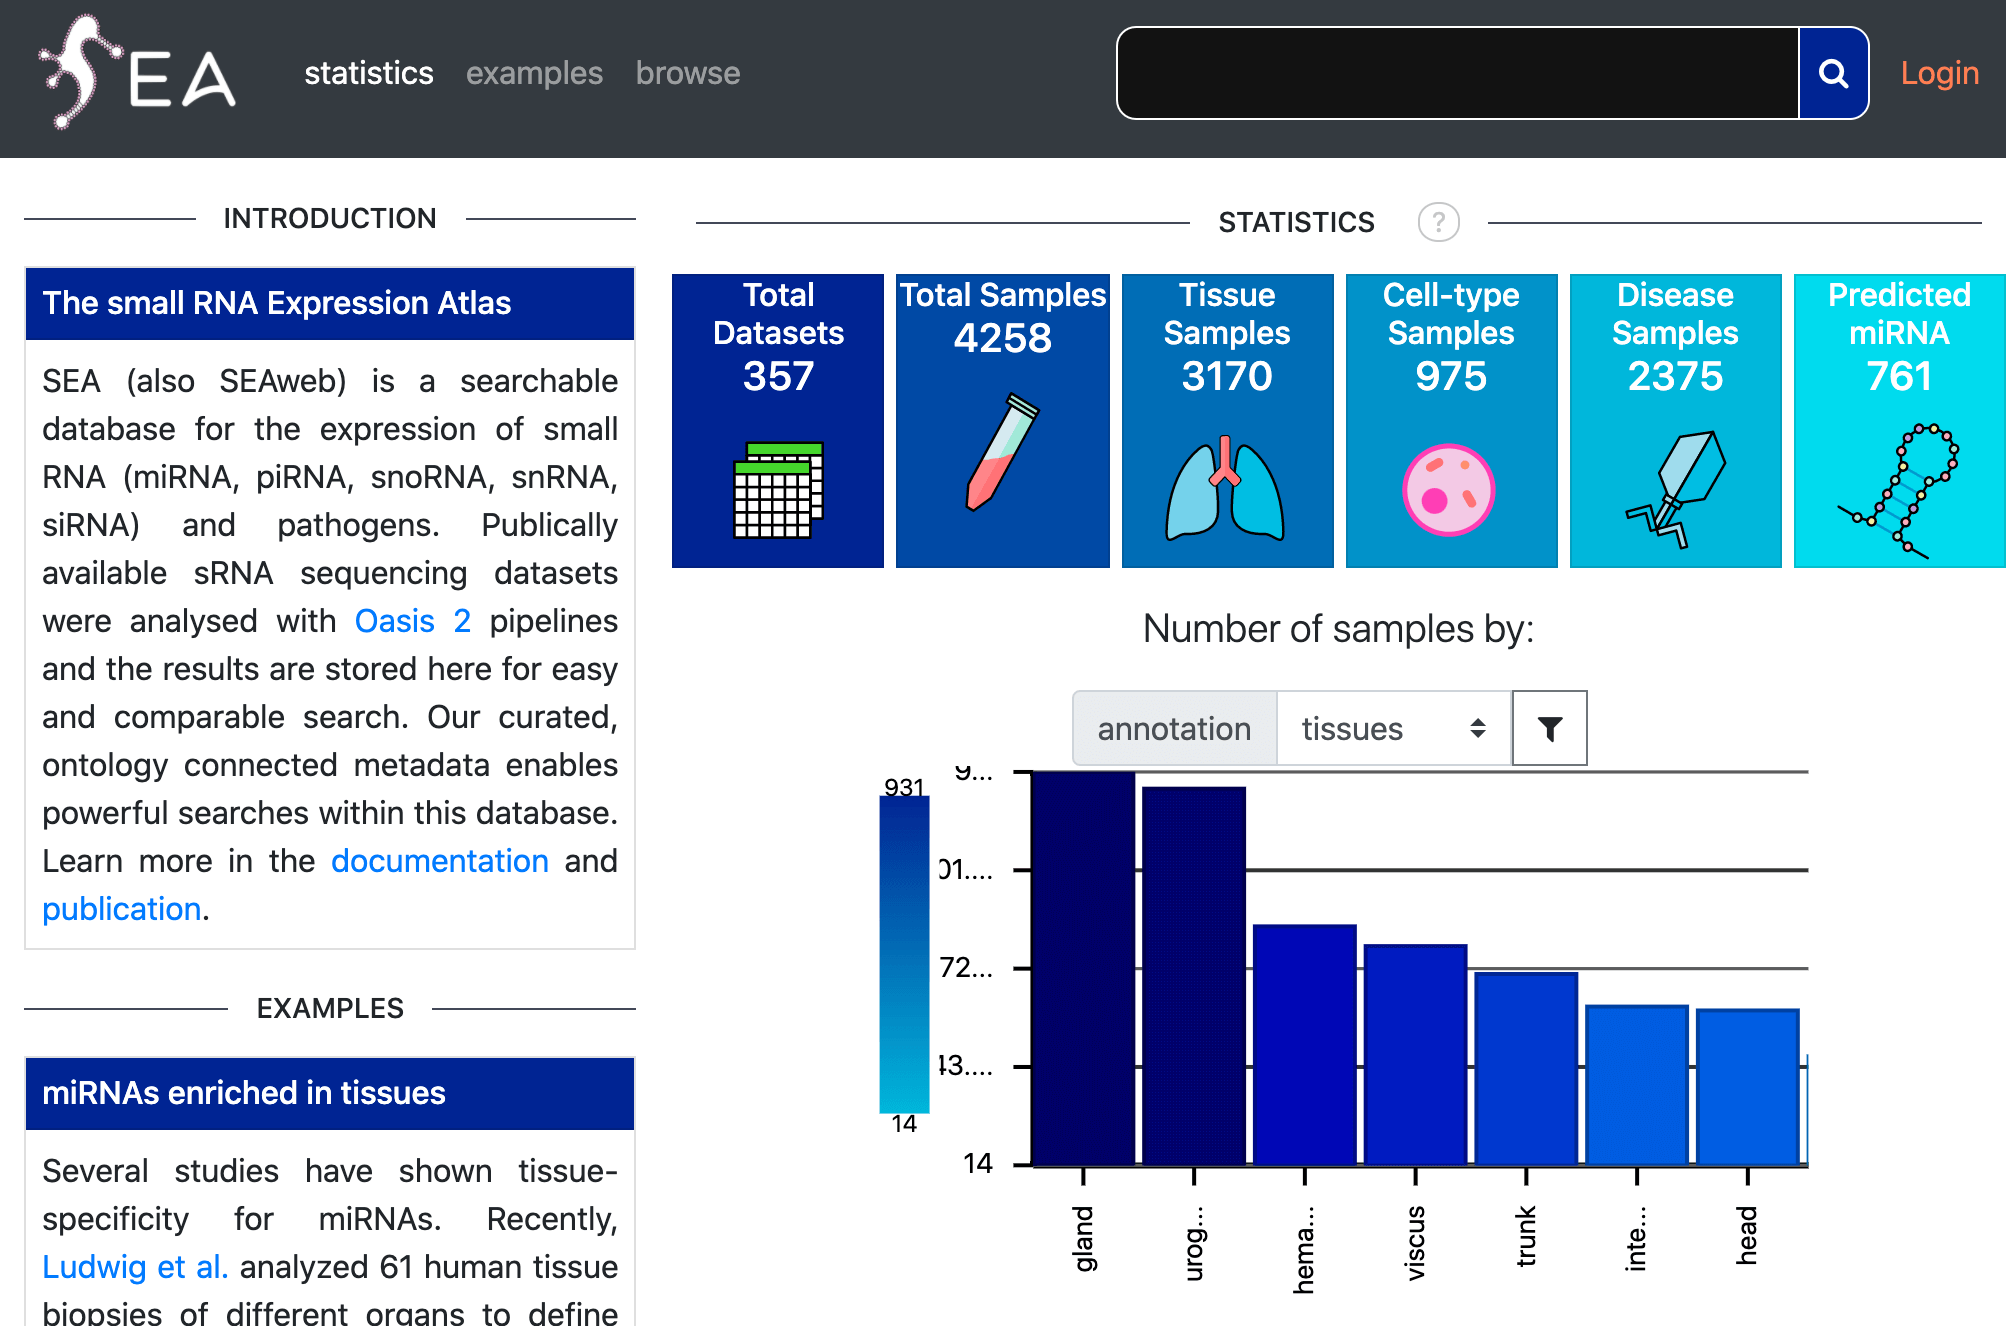
  • The Small RNA Expression Atlas (SEAweb) is a web application that allows for the interactive querying, visualization and analysis of known and novel small RNAs across 10 organisms. It contains sRNA and pathogen expression information for over 4200 published samples with standardized search terms and ontologies. In addition, SEAweb allows for the interactive visualization and re-analysis of 879 differential expression and 514 classification comparisons. SEAweb's user model enables sRNA researchers to compare and re-analyze user-specific and published datasets, highlighting common and distinct sRNA expression patterns. We provide evidence for SEAweb's fidelity by (i) generating a set of 591 tissue specific miRNAs across 29 tissues, (ii) finding known and novel bacterial and viral infections across diseases and (iii) determining a Parkinson's disease-specific blood biomarker signature using novel data. We believe that SEAweb's simple semantic search interface, the flexible interactive reports and the user model with rich analysis capabilities will enable researchers to better understand the potential function and diagnostic value of sRNAs or pathogens across tissues, diseases and organisms.

    SEA

    The Small RNA Expression Atlas.

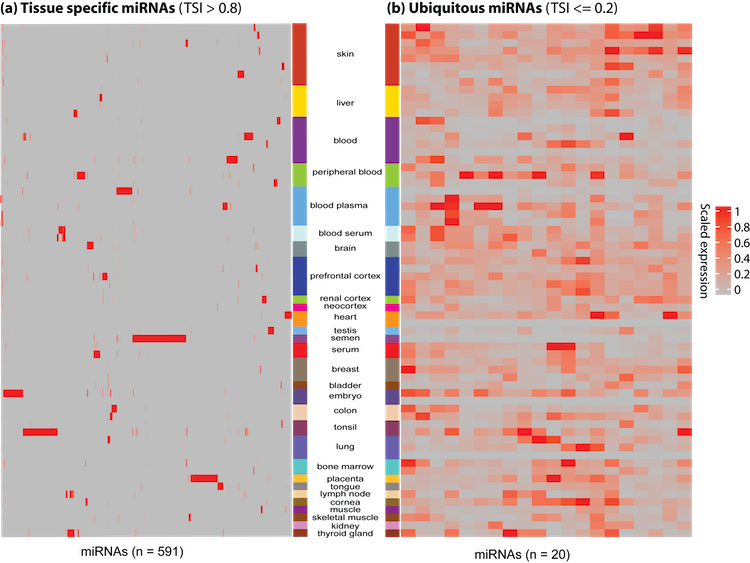
  • The heatmaps show the scaled expression (0-1) of (A) tissue specific or (B) ubiquitous miRNAs across
                           all the tissues. (A) Tissue specific miRNAs. miRNA expression across all the tissues with TSI > 0.8
                           (n = 591). (B) Ubiquitous miRNAs. miRNA expression across all the tissues with TSI ≤ 0.2 (n = 20).
                           miRNA names are omitted for simplicity.

    micro RNA tissue specificity

    Traditional biomarkers lack tissue specificity.

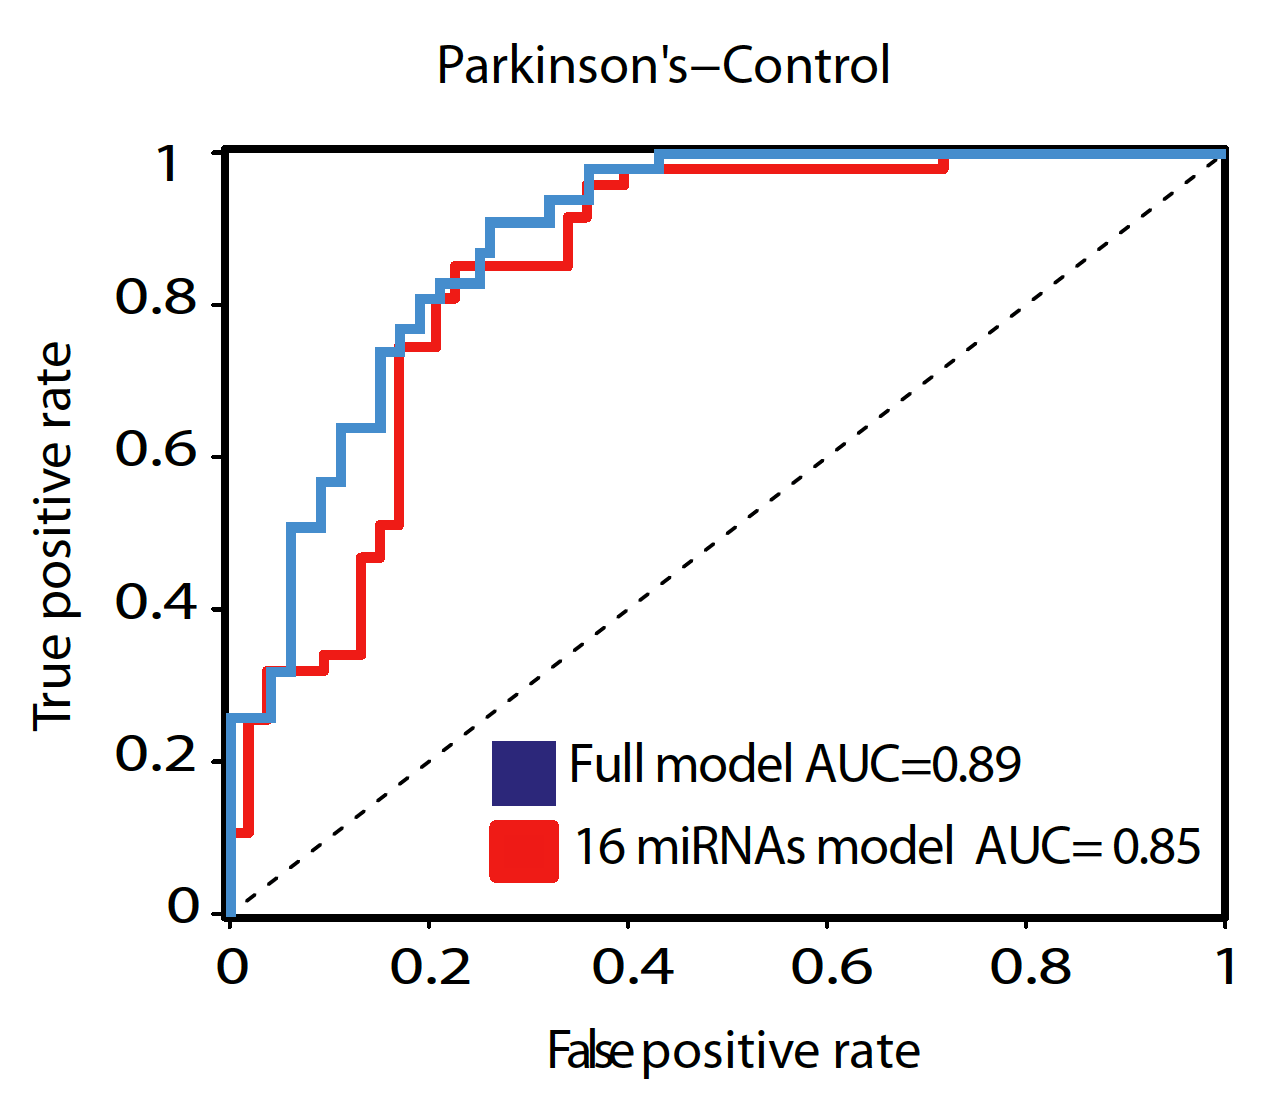
  • Receiver‐operating characteristic (ROC) curve showing true‐ and false‐positive rates for DeNoPa disease prediction based on sRNA expression profile using 18 sRNAs in full model (blue) and 16 unique (not found in other neurodegenerative diseases) sRNAs (red).

    Parkinson disease biomarkers

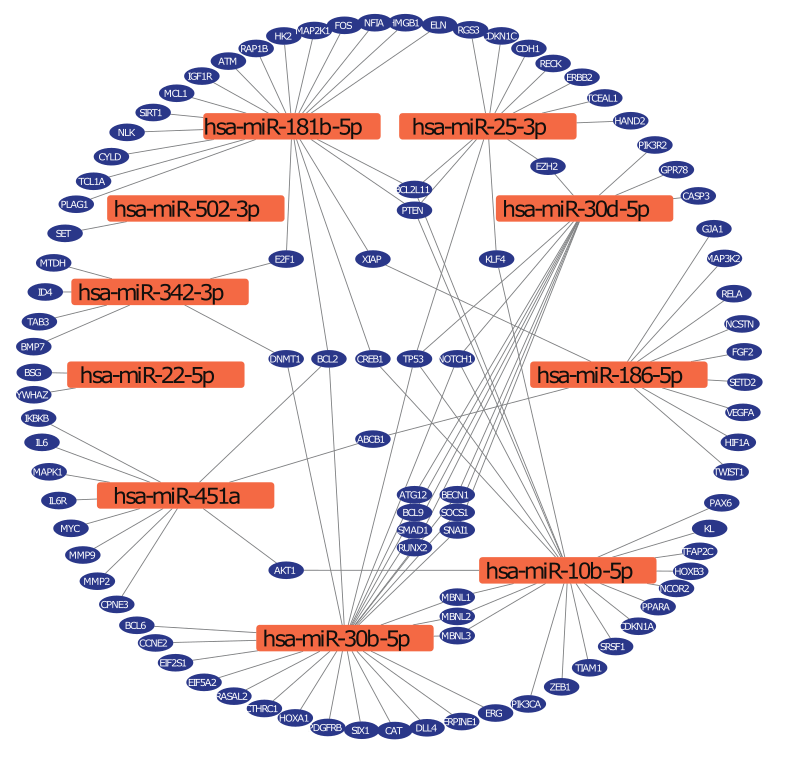
  • Parkinson's disease associated miRNAs and genes interaction network. Network of Parkinson's disease associated genes and 13 known miRNAs from the classification.

    Interaction network

    Parkinson's disease associated miRNAs and target genes.

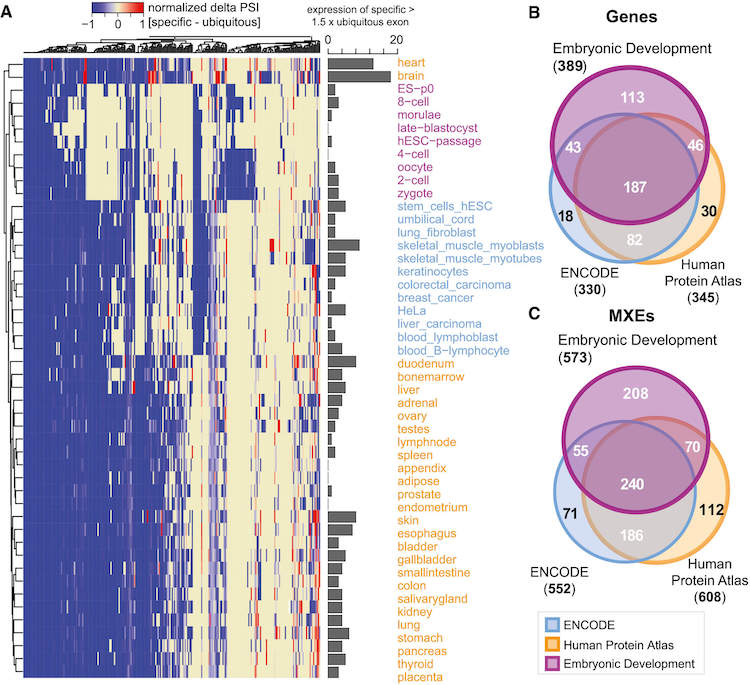
  • A. Heatmap showing all differentially expressed MXE clusters with at least three RPKM. Here, we used the Gini coefficient, which is a measure of the inequality among values of a frequency distribution (Ceriani & Verme, 2012) and has successfully been used to determine tissue‐enriched gene sets (Zhang et al , 2017), to determine highly tissue‐specific MXEs (maximum normalized Gini index of cluster) and MXEs with a broad tissue expression distribution (minimum Gini index). For each MXE cluster, the per cent‐spliced‐in (PSI) value of the ubiquitous MXE (minimum Gini index) is subtracted from the PSI value of the specific MXE (maximum Gini index of cluster) (delta PSI value) and scaled between −1 (broad tissue distribution) and 1 (highly tissue specific). Each column represents an MXE pair, and each row represents MXE expression in a tissue, cell type or at a developmental time point. The bar graph summarizes counts where the specific MXE is 1.5‐fold more spliced in than the ubiquitous MXE. <br> B. Overview of differentially expressed genes for the Embryonic Development, ENCODE and Human Protein Atlas datasets. <br> C. Overview of differentially expressed MXEs for the Embryonic Development, ENCODE and Human Protein Atlas datasets.

    MXEs.

    MXEs are tissues & developmental stages specific.

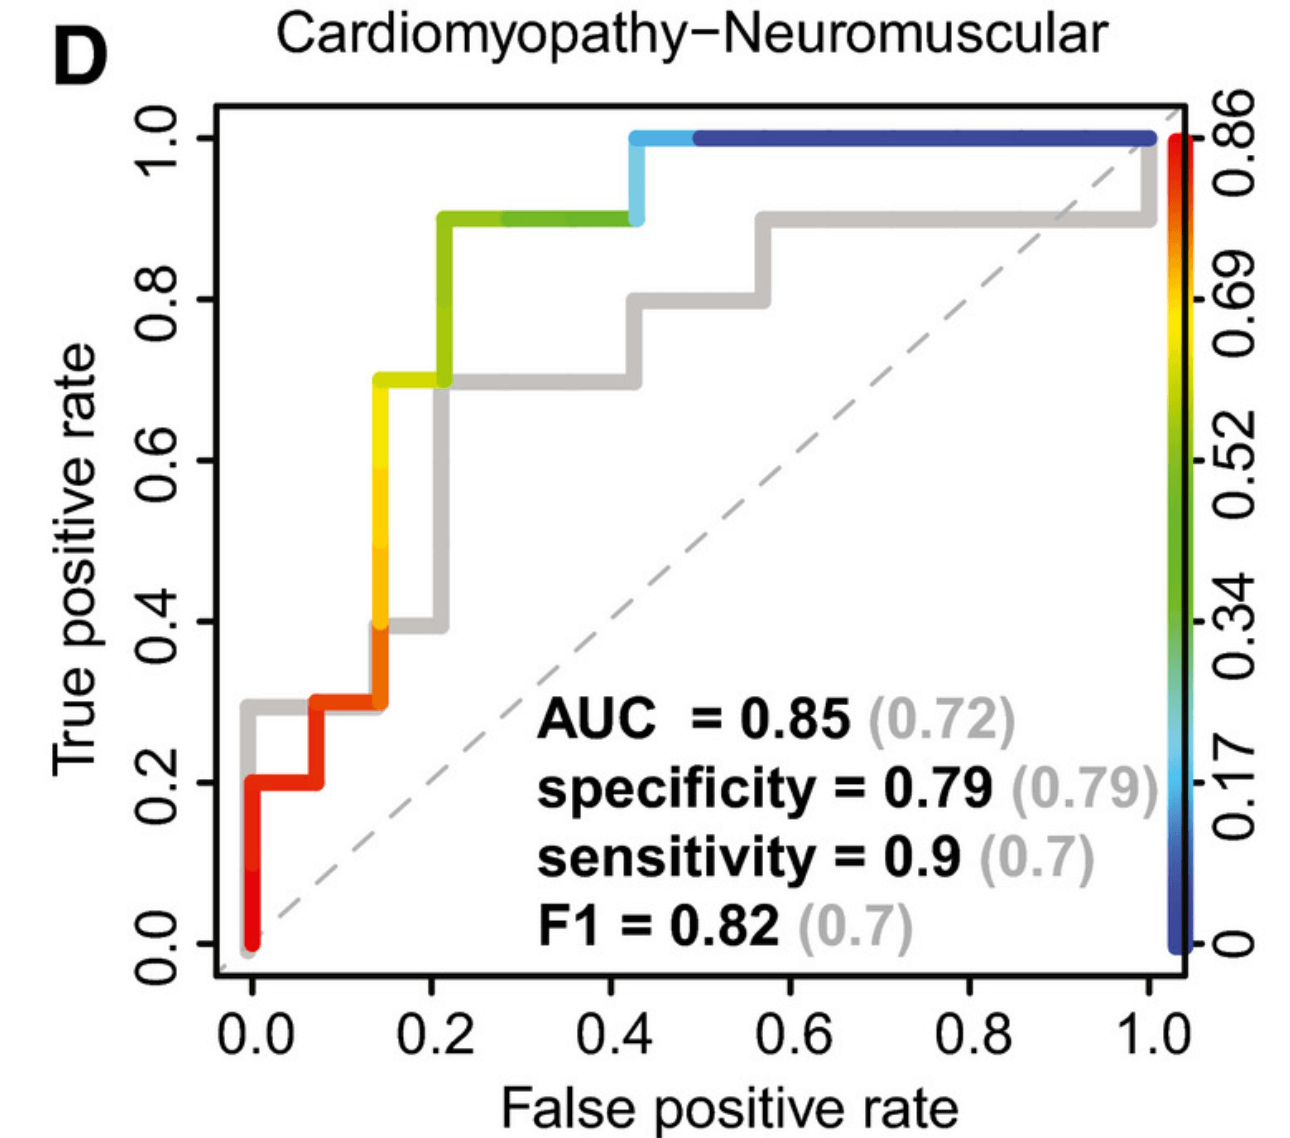
  • To assess whether MXE pathogenicity follows observable rules, we trained a machine learner on MXE expression data and predicted the affected target tissue. Cardiac‐neuromuscular diseases could be predicted with an accuracy of 83% (P ‐value < 0.01), a specificity of 79%, a sensitivity of 90% and an area under the ROC curve (AUC) of 85%.
                           <br>Receiver‐operating characteristic (ROC) curve showing true‐ and false‐positive rates for cardiomyopathy‐neuromuscular disease prediction based on spatio‐temporal MXE (coloured lines and black text) and RPKM‐based gene (grey lines and text) expression (delta PSI values).

    MXE pathogenicity

    Can MXE expression predict pathogenicity?

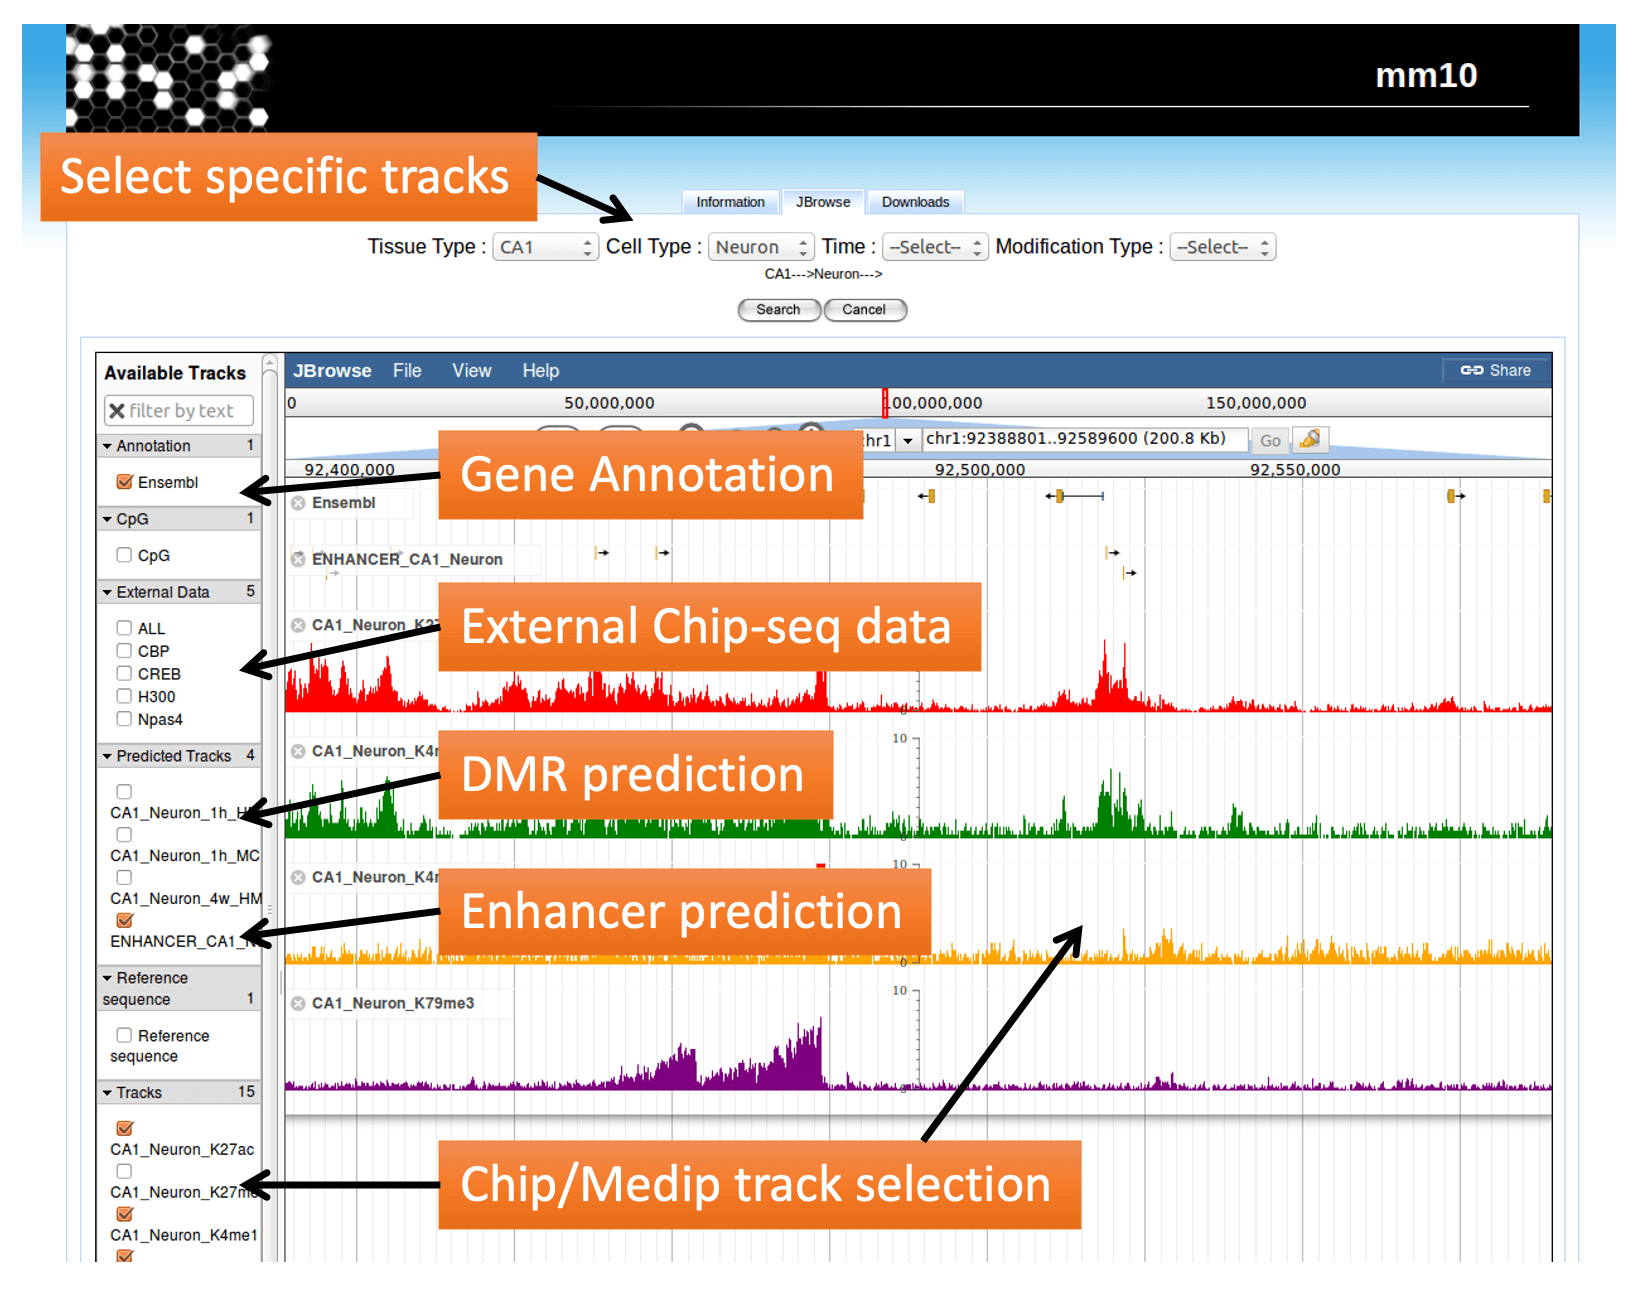
  • Integration of open source interactive genome browser for inhouse next generation sequencing data.
                           This web application was developed in order to make the RNA-seq, Chip-Seq , MeDIP data of a project available to the scientific community. Make it easy to visualize, search-able for different tissues, cells and time points along with the modification types.

    Genome Browser

    Make it easy to visualize.

Contact

Leave a Message

Contact Us

TeGnostiX388 Bridle Path,
Worcester, MA, 01604
USA

Phone: +1-617-2299738

info (at) TeGnostiX (dot) com